Introduction
The DeNovix DS-11 Series instruments and the Thermo Fisher NanoDrop™ One spectrophotometer are used for rapid quantification of nucleic acids and proteins. The DS-11 Series Spectrophotometer / Fluorometer offers best-in-class limits of detection, the broadest dynamic range, intuitive ease of use and powerful networking features that are superior to the Thermo Fisher NanoDrop™ One spectrophotometer. This note presents a comparison of features (Table 1) and side-by-side instrument performance (Tables 2 and 3).
The DeNovix DS-11 Spectrophotometer, introduced to the market in 2013, was the first standalone, touchscreen-controlled and network-connected UV-Vis spectrophotometer in the world. In collaboration with the life science community, DeNovix expanded the instrument’s features and functionality to include a highly sensitive, integrated fluorometer creating the DS-11 Series Spectrophotometer / Fluorometer.
The patented (US9442009) DS-11 FX+ instrument features best-in-class limits of detection for microvolume absorbance (0.75 – 37500 ng/µL dsDNA) and fluorescence quantification (0.5 pg/µL dsDNA). Labs may select from models with any combinatiuon of microvolume UV-Vis, cuvette UV-Vis and fluorescence detection.
Table 1: DeNovix DS-11 Series Spectrophotometer / Fluorometer Comparison to Thermo Fisher NanoDrop™ One spectrophotometer| DeNovix DS-11 Series | Thermo Fisher NanoDrop™ Onec |
|
|---|---|---|
| Spectrophotometer / Fluorometer | Spectrophotometer | |
| Fluorescence Option | Yes - DS-11 FX and DS-11 FX+ (UV, Blue, Red, Green) | None |
| Dynamic Range (dsDNA) | 0.5 pg/μL* - 37500 ng/μL | 0.2 ng/μL - 27500 ng/μL |
| Protein Performance | Outstanding | Only if sample column is properly formed |
| Microvolume Lower Detection Limit | dsDNA: 0.75 ng/μL, BSA: 0.04 mg/mL | dsDNA: 2.0 ng/μL, BSA: 0.06 mg/mL |
| Cuvette Lower Detection Limit | dsDNA: 0.04 ng/μL, BSA: 0.002 mg/mL | dsDNA: 0.2 ng/μL, BSA: 0.006 mg/mL |
| Max Concentration | dsDNA: 37500 ng/μL, BSA: 1125 mg/mL | dsDNA: 27500 ng/μL, BSA: 820 mg/mL |
| Wavelength Range | 190-840 nm | 190-850 nm |
| Absorbance Range | 0.015 - 750 A | 0.04 - 550 A |
| Wavelength Accuracy (Absorbance) | 0.5 nm | 1 nm |
| Absorbance Accuracy | 1.5% at 0.75 AU at 260nm | 3% at 0.97 AU at 302nm |
| Microvolume Pathlength | 0.5 to 0.02 mm | 1.0 to 0.03 mm |
| Pathlength Verification | SmartPath™ technology with Bridge Testing™ verification | Auto adjusting |
| Pathlength Control | Precision screw driven by high resolution motor | Adjustment screw driven by stepper motor |
| Contamination Alert Software | SmartQC™ contamination alerts | Yes |
| Data Export | Network Drives and Printers, Email, USB, Label Printers | USB, Label Printer, Networks |
| Networking | Wi-Fi and Ethernet | Wi-Fi not available in all areas, Ethernet |
| Color Choices | Arctic White, Brazilian Blue, Tungsten Silver, Fire Red | No |
| Ergonomics | Optimized screen and sample pedestal location | Extended reach required |
SmartPath™ Technology with Bridge Testing™ Verification
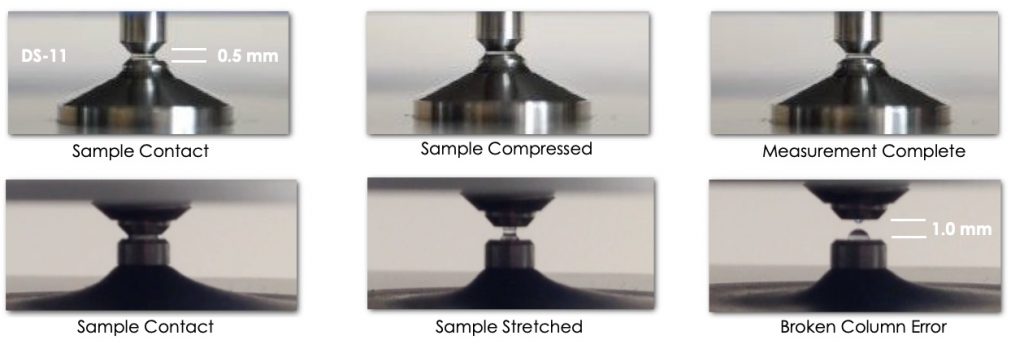
DeNovix Spectrophotometers employ proprietary algorithms and hardware that overcome previous limitations of microvolume instruments. Analysis begins at a pathlength of 0.5 mm and compresses the sample during the measurement until the optimum pathlength is reached. DS-11 Series instruments do not stretch the droplet. Compressing prevents an unbridged condition (broken column) that can lead to inaccurate results (Figure 1).
On systems that rely on stretching samples, a broken column may occur if insufficient sample volume is pipetted for a microvolume measurement, if samples have low surface tension (common for protein solutions) or if the measurement surface loses its hydrophobic property. With Bridge Testing, DeNovix instruments detect if a sample is not bridging the optical surfaces and automatically compensates to provide a correct measurement in real time. Conversely, the Thermo Fisher NanoDrop™ One spectrophotometer stretches the sample column to 1.0 mm and only alerts the user to a sample column anomaly without reporting a measurement result.
Figure 1: Top – DS-11 Series showing compression of sample droplet. Bottom – Competitor instrument showing sample stretching and breaking of the sample column.
DeNovix dsDNA Fluorescence Assays
DeNovix manufactures three ranges of highly sensitive and selective dsDNA assays. These assays, when combined with the DS-11 Series Fluorometer, enable quantification of dsDNA to 0.5 pg/µL, which is 1000x greater sensitivity than microvolume spectrophotometers. Each assay is a simple two-point standard, mix-and-measure kit. The assays allow for accurate quantification of dsDNA in the presence of RNA, degraded DNA and other contaminants.
Microvolume Performance Evaluation Methods
A 40 mg/mL solution of dsDNA was gravimetrically prepared using biotechnology grade fish sperm DNA sodium salt (Amresco cat #1B1509-256) and HPLC grade water (Ricca cat #9153-1). A series of dilutions from 12500 to 0.75 ng/µL was then prepared in HPLC grade water.
Reference concentrations for the dilutions were determined using an Agilent 8453 (Agilent, Santa Clara CA) in a 1 mm quartz cuvette (Starna, cat #1-Q-1). The reference value for DNA solutions with absorbance values outside of the Agilent’s upper range of 2.0 A (equivalent to 1000 ng/μL dsDNA) were determined by gravimetrically diluting these samples to fall within the linear range of the reference spectrophotometer. Measurements were made using the dsDNA app for each instrument.
Due to the challenges of creating high concentration dsDNA samples (600-750 A), performance was evaluated using nicotinic acid and the Custom Formula Methods app on the DS-11. An 18.5 mg/mL solution of nicotinic acid was prepared gravimetrically using 99.5% Nicotinic Acid (Sigma cat #72309-100) and 0.1 N HCl (Fisher cat #SA50-1) (Ricca cat #9153-1). A series of dilutions was prepared from 18.5 to 13.5 mg/mL.
The applicable measurement app was launched on each instrument, and a microvolume mode Blank measurement was made using 1 μL of HPLC grade water. Five sample measurements were then made for each concentration. Fresh 1 μL aliquots were used for each replicate measurement. The sample solution was removed after each measurement by wiping the upper and lower sample surfaces with a clean, dry laboratory wipe. The results of this evaluation are shown in Tables 2 and 4.
Fluorescence Performance Evaluation Methods
The DS-11 FX+ Fluoro dsDNA app and DeNovix dsDNA Quantification Assays were used in the quantification of dsDNA for this evaluation. Each assay was prepared as described in the manufacturer’s protocol. Samples were mixed and incubated at room temperature for five minutes. Three replicate measurements were taken for each sample. DeNovix Assays were measured on the DeNovix Fluorometer (Table 3).
DeNovix Broad Range and High Sensitivity Assays
A series of dilutions of calf thymus DNA was prepared in TE buffer. Working solution (190 µL) was added to a thin-walled, clear UV-transparent 0.5 mL PCR tube (DeNovix cat #TUBE-PCR-0.5-500). dsDNA (10 µL) was added to each tube in the standard range, and volume was adjusted for total mass in the extended range.
Ultra High Sensitivity Assay
Working solution (200 µL) was added to a thin-walled, clear UV-transparent 0.5 mL PCR tube. dsDNA (10 µL) was added to each tube.
| Expected | DeNovix DS-11 Spectrophotometer | Thermo Fisher NanoDrop™ One Spectrophotometer | ||||
|---|---|---|---|---|---|---|
| ng/µL | ng/µL | % error | %CV | ng/µL | % error | %CV |
| 0.97 | 0.70 | 27.5 | 42.23 | |||
| 2.00 | 2.80 | 40.0 | 8.29 | 3.08 | 54.0 | 13.26 |
| 4.05 | 4.88 | 20.5 | 8.82 | 4.84 | 19.5 | 10.33 |
| 6.05 | 5.64 | 6.78 | 9.64 | 7.52 | 24.30 | 54.12 |
| 7.38 | 6.83 | 7.45 | 6.65 | 6.78 | 8.13 | 3.69 |
| 13.49 | 14.21 | 5.34 | 4.18 | 13.26 | 1.70 | 0.85 |
| 26.74 | 27.66 | 3.44 | 4.28 | 26.72 | 0.07 | 0.78 |
| 50.23 | 53.31 | 6.13 | 1.35 | 53.56 | 6.63 | 0.54 |
| 108.26 | 113.0 | 4.38 | 0.35 | 112.8 | 4.19 | 0.53 |
| 255.23 | 259.9 | 1.83 | 0.60 | 263.4 | 3.20 | 0.15 |
| 513.26 | 509.2 | 0.79 | 0.35 | 521.6 | 1.62 | 0.09 |
| 1036.8 | 1020.7 | 1.55 | 0.14 | 1070.2 | 3.22 | 0.22 |
| 2082.8 | 2102.1 | 0.93 | 0.17 | 2113.7 | 1.48 | 0.13 |
| 4720.8 | 4628.4 | 1.96 | 0.37 | 4524.3 | 4.16 | 0.11 |
| 10390 | 10118 | 2.62 | 0.67 | 9997 | 3.78 | 0.12 |
| 12616 | 12444 | 1.36 | 0.49 | 12042 | 4.55 | 0.26 |
| 26269 | 24295 | 7.51 | 0.79 | 23773 | 9.50 | 0.14 |
Table 3: Fluorescence Performance Data
| Expected | DeNovix DS-11 FX+ Spectrophotometer / Fluorometer | Thermo Fisher NanoDrop™ One Spectrophotometer |
||
|---|---|---|---|---|
| ng/µL | ng/µL | %CV | Assay* | |
| 0.0005 | 0.00036 | 6.89 | UHS | Fluorescence quantitation not possible. |
| 0.0010 | 0.00109 | 8.75 | UHS | Requires purchase of additional instrument. |
| 0.0020 | 0.0018 | 2.23 | UHS | |
| 0.0100 | 0.0085 | 1.06 | UHS | |
| 0.0500 | 0.0452 | 0.40 | UHS | |
| 0.10 | 0.07 | 0.00 | HS | |
| 0.30 | 0.25 | 0.16 | HS | |
| 1.00 | 0.79 | 0.10 | HS | |
| 3.00 | 3.04 | 0.20 | HS | |
| 10.0 | 10.6 | 0.36 | HS | |
| 25.0 | 26.8 | 0.11 | BR | |
| 50.0 | 53.8 | 0.10 | BR | |
| 100 | 106 | 0.09 | BR | |
| 200 | 196 | 0.14 | BR | |
| 1000 | 1050 | 0.01 | BR | |
| Expected | dsDNA Equivalent | DeNovix DS-11 Spectrophotometer | Thermo Fisher NanoDrop™ One Spectrophotometer |
||
|---|---|---|---|---|---|
| Abs | ng/µL | Abs | % error | %CV | Abs |
| 600 | 30000 | 588.8 | 1.87 | 0.35 | Above Specification Limits |
| 650 | 32500 | 628.9 | 3.24 | 0.41 | |
| 700 | 35000 | 676.7 | 3.36 | 0.66 | |
| 750 | 37500 | 732.7 | 2.44 | 1.32 | |
Summary
The DeNovix DS-11 Series Spectrophotometer / Fluorometer delivers greater accuracy and sensitivity than the Thermo Fisher Scientific NanoDrop™ One spectrophotometer. The DeNovix DS-11 also offers a broader dynamic range, greater ease of use and provides researchers with superior flexibility and functionality.
The DS-11 Series Spectrophotometer / Fluorometer combines microvolume absorbance and fluorescence measurements on one instrument, supplying the user with tools to measure both routine and difficult samples. With the DS-11 Series, labs are equipped for today’s complex workflow as well as for the challenges of future assays. The DS-11 Series and DeNovix Assays combined provide superior sensitivity and a much broader dynamic range for dsDNA quantification (0.5 pg/µL – 37500 ng/µL) than the Thermo Fisher NanoDrop™ One spectrophotometer.
NanoDrop™ and NanoDrop™ One are registered trademarks of Thermo Fisher Scientific and its subsidiaries and are used for identification and references purposes only. DeNovix, DeNovix products and this website are not endorsed by Thermo Fisher Scientific.
28-MAR-2024


