Introduction
The 1 mm pathlength used by some microvolume spectrophotometers works well enough for nucleic acid measurements. However, this pathlength presents challenges when measuring purified proteins.
The 0.5 mm path utilized by the next generation DeNovix DS-11 Series has addressed this issue, making it the ideal instrument for the quantitation of a broad concentration range of protein samples. The purpose of this technical note is to present data demonstrating the superior performance of the DS-11 Series when measuring protein samples across a wide range of concentrations.
Spectrophotometers are evaluated based on their precision and linearity. Precision describes the reproducibility of measurements on a spectrophotometer. The DS-11’s SmartPath™ technology enables highly reproducible measurements with an absorbance precision of 0.015 AU (1 cm) at absorbances below 6 mg/mL BSA and 1% or less variance at absorbances greater than 6 mg/mL BSA.
Linearity is an assessment of a spectrophotometer’s working range. The DS-11 is capable of reading absorbance values from 0.015 A to 750 A (1 cm equivalent). This translates to a lower limit of 0.04 mg/mL BSA, or 0.02 mg/mL IgG, and an upper limit of 1125 mg/mL BSA or 548 mg/mL IgG. This broad range virtually ensures that diluting protein samples is unnecessary, thus eliminating time and reducing associated errors.
Materials
A series of dilutions was prepared to cover a large portion of the DS-11’s linear range using a 300 mg/mL BSA stock (Sigma-Aldrich cat #A7284) diluted in 1x sterile filtered phosphate buffered saline (PBS) (Pierce cat #28372). Reference concentrations were determined using the 280 nm absorbance values obtained on an Agilent 8453 reference spectrophotometer (Agilent, Santa Clara CA) in a 1 mm quartz cuvette (Starna, cat #1-Q-1). The absorbance value, along with an E1% value of 6.67, were used in the Beer-Lambert equation to calculate concentration.
Methods
The upper absorbance range of the Agilent spectrophotometer is ~2.0 A, which is equivalent to 30 mg/mL BSA. The reference values for test solutions above this limit were determined by gravimetrically diluting the samples to fall within the Agilent’s range.
The Protein A280 app was launched, and a microvolume mode Blank measurement was made using 1.5 μL of PBS. Five measurements were then made for each sample concentration. Fresh 1.5 μL aliquots were used for each replicate measurement. The sample solution was removed between each measurement by wiping the upper and lower sample surfaces with a clean, dry laboratory wipe.
Precision Results
A standard deviation of +/- 0.04 mg/mL for BSA samples < 3 mg/mL meets the specified absorbance precision of 0.015 AU (1 cm) or 1%, whichever is greater. In addition, the reported % CV of 1% or less meets specified absorbance precision for samples BSA > 3 mg/mL (Table 1).
| Expected mg/mL | Average mg/mL | StDev | %CV |
|---|---|---|---|
| 0.045 | 0.044 | 0.0048 | 11.1 |
| 0.109 | 0.104 | 0.0052 | 5.0 |
| 0.500 | 0.495 | 0.015 | 3.1 |
| 1.08 | 1.02 | 0.036 | 3.5 |
| 3.05 | 2.98 | 0.025 | 0.83 |
| 21.5 | 20.0 | 0.063 | 0.32 |
| 42.6 | 39.8 | 0.116 | 0.29 |
| 128.8 | 129.0 | 0.488 | 0.38 |
| 201.2 | 207.5 | 1.053 | 0.51 |
| 250.4 | 252.8 | 0.802 | 0.32 |
| 281.0 | 281.8 | 0.698 | 0.24 |
Linearity Results
The linear response of the DS-11 Spectrophotometer for protein samples is presented below. Target absorbances were determined using an Agilent 8453 reference spectrophotometer.
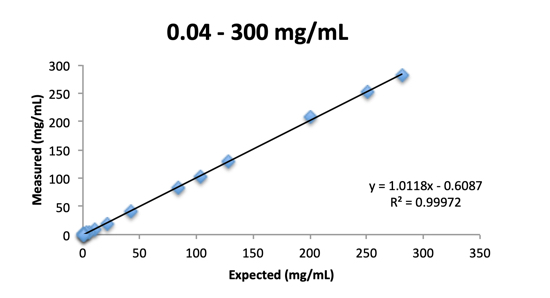
Figure 1 shows the linearity results for the full concentration range tested. The dilutions series chosen for this study highlight the DS-11’s ability to measure highly concentrated samples.
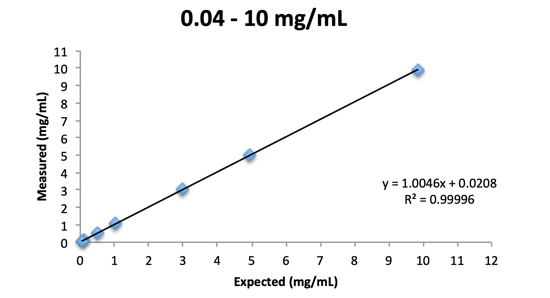
The second graph (Figure 2) shows the linearity results for just the lower concentration range to better visualize the outstanding linearity in this range.


Carryover
Protein samples are known to be stickier than typical nucleic acid solutions. Some labs have chosen to restrict the use of other microvolume spectrophotometers to either nucleic acids or proteins out of concern of carryover.
A study was performed to demonstrate that even very high concentration protein samples can be effectively removed from the DS-11 sample surfaces, eliminating the concern of carryover. For this study, the sample surface was vigorously wiped after each of the five measurements using an ultra high concentration BSA sample. Five replicates of PBS were then taken on the DS-11 with the expected results to be within the +/- 0.04 mg/ml lower detection limit of the instrument. The results are presented in Table 2.
| Sample | Average mg/mL |
|---|---|
| BSA | 313.89 |
| PBS | -0.004 |
Summary
The findings presented in this document demonstrate that the DeNovix DS-11 Microvolume Spectrophotometer meets the published precision and linearity range specifications for protein samples.
SmartPath technology automatically uses multiple pathlengths to enable absorbance measurements across a broad linear range using only 1.5 μL aliquots per measurement. As shown in Figures 1 and 2, samples with concentrations over 4 orders of magnitude may be routinely analyzed without making dilutions or using special caps or cuvettes.
The ease of use, coupled with the broad absorbance range capabilities of the DS-11, makes this the ideal microvolume spectrophotometer choice for routine laboratory quantification of purified protein samples.
For measuring up to eight samples at a time, learn more about the DS-8X Eight Channel Spectrophotometer.
08-APR-2025


