Introduction
The precision specification associated with a spectrophotometer is an assessment of the reproducibility of measurements. The DeNovix DS-11 Series is equipped with SmartPath™ technology. This enables reproducible nucleic acid measurements with an absorbance precision of 0.015 AU (1 cm) or 1% (whichever is greater) at concentrations below 50 ng/μL and 1.5% or less variance at concentrations greater than 50 ng/μL dsDNA.
Linearity specifications refer to the working range of a spectrophotometer. The DS-11 has a linear range from 0.015 A – 750 A (1 cm equivalent), translating to 0.75 – 37500 ng/μL dsDNA. The DS-11 offers outstanding accuracy within the broadest linear range of any spectrophotometer on the market today.
To highlight the precision and accuracy of the instrument over the most commonly used range of the instrument, a dilution series of purified double stranded DNA was prepared. Five replicates of each concentration were measured using the dsDNA app.
Materials
A 30 mg/mL solution of dsDNA was gravimetrically prepared using biotechnology grade fish sperm DNA sodium salt (Amresco cat #1B1509-256) and HPLC grade water (Ricca cat #9153-1). A series of 15 dilutions ranging from ~26000 – 2 ng/μL was then prepared using the HPLC grade water.
Reference concentrations for the dilutions were determined using an Agilent 8453 (Agilent, Santa Clara CA) in a 1 mm quartz cuvette (Starna, cat #1-Q-1). The reference value for DNA solutions with absorbance values outside of the Agilent’s upper range of 2.0 A (equivalent to 1000 ng/μL dsDNA) were determined by gravimetrically diluting these samples to fall within the linear range of the reference spectrophotometer.
Methods
The dsDNA app was launched and a microvolume mode Blank measurement was made using 1 μL of HPLC grade water. Five measurements were then made for each dsDNA sample concentration. Fresh 1 μL aliquots were used for each replicate measurement. The sample solution was removed between each measurement by wiping the upper and lower sample surfaces with a clean, dry laboratory wipe.
Concentrations were calculated by applying Beer’s Law using 10 mm equivalent 260 nm absorbance values.
Precision Results
The reported % CVs of 1.5% or less meets the specified absorbance precision for samples > 50 ng/μL dsDNA.
Low Concentrations and % Error
All spectrophotometers have a detectable level of background noise contributed by the environment and internal electronic components. The LDL is the lowest quantity of analyte that can be distinguished from this background noise. For the DS-11 microvolume mode, the LDL is 0.75 ng/μL dsDNA.
It is important to note that the % error can be high when measuring close to the LDL even for instruments meeting specifications. It is recommended that replicate measurements be made when quantifying very low concentration samples.
| Expected ng/μL | Average ng/μL | %Error | %CV |
|---|---|---|---|
| 2.00 | 2.80 | 40.0 | 8.29 |
| 4.05 | 4.88 | 20.5 | 8.82 |
| 7.38 | 6.83 | 7.45 | 6.65 |
| 13.49 | 14.21 | 5.34 | 4.18 |
| 26.74 | 27.66 | 3.44 | 4.28 |
| 50.23 | 53.31 | 6.13 | 1.35 |
| 108.26 | 113.0 | 4.38 | 0.35 |
| 255.23 | 259.9 | 1.83 | 0.60 |
| 513.26 | 509.2 | 0.79 | 0.35 |
| 1036.8 | 1020.7 | 1.55 | 0.14 |
| 2082.8 | 2102.1 | 0.93 | 0.17 |
| 4720.8 | 4628.4 | 1.96 | 0.37 |
| 10390 | 10118 | 2.62 | 0.67 |
| 12616 | 12444 | 1.36 | 0.49 |
| 26269 | 24295 | 7.50 | 0.79 |
Linearity Results
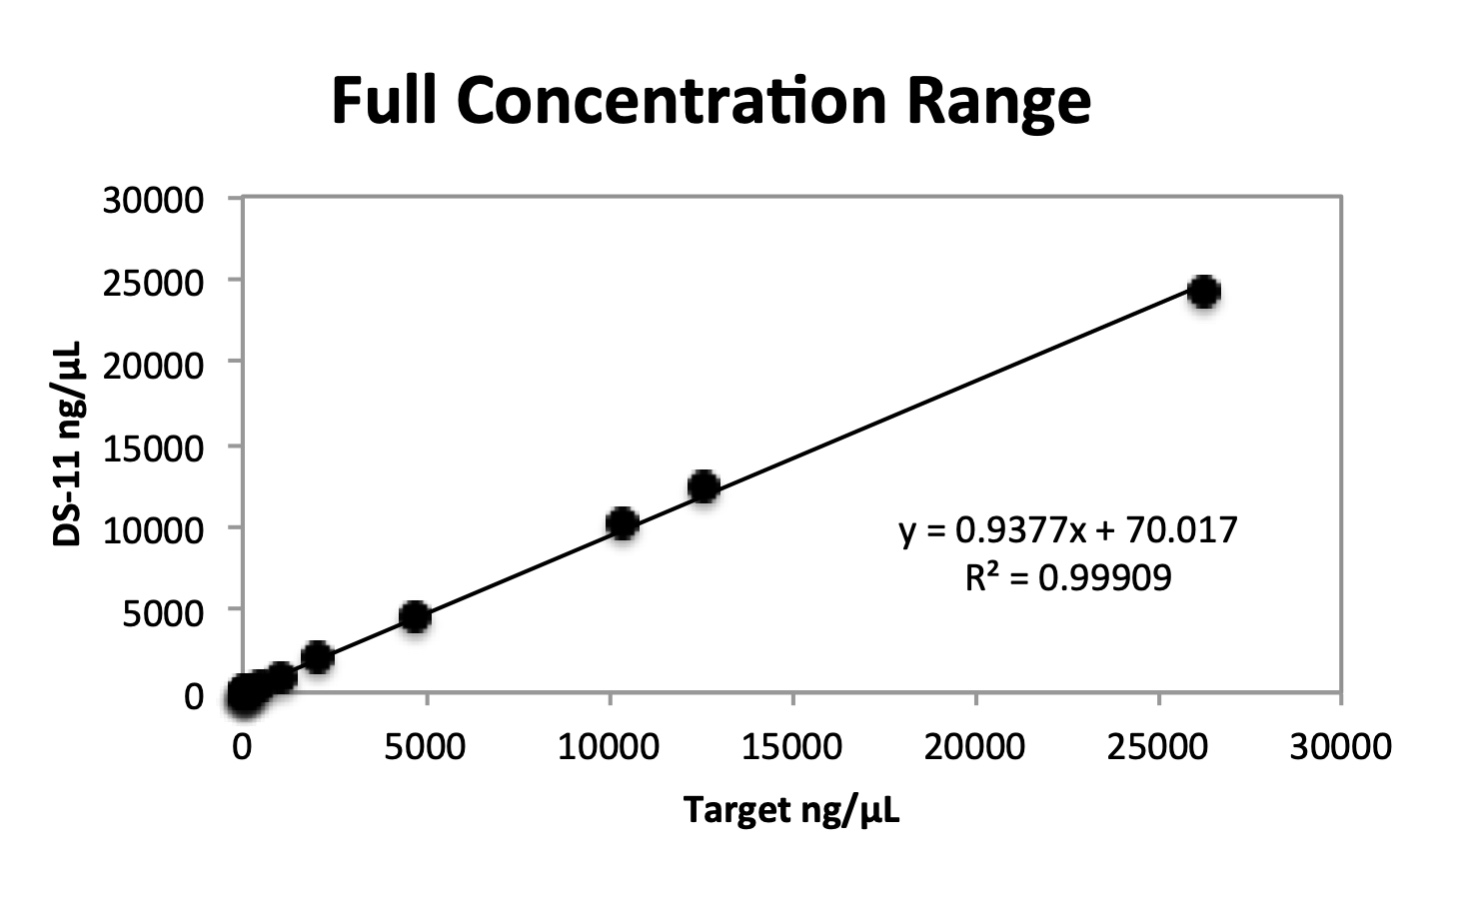
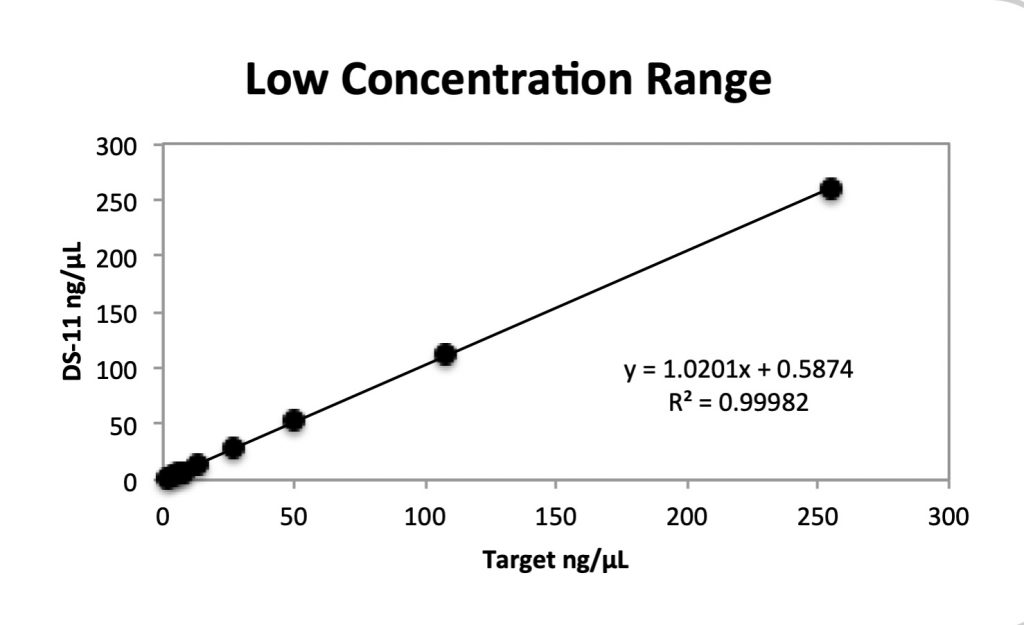
Graphical representations of the broad linear range response of the DS-11 Spectrophotometer are presented below. Target absorbances were determined as previously described.
The first graph (Figure 1) shows the linearity results for a broad concentration range. The second graph (Figure 2) shows the linearity results for just the lower concentration range to better visualize the outstanding linearity in this range.
Discussion
The data presented in Table 1 and graphically represented in Figures 1 and 2 demonstrate that the DS-11 Series meets the published precision and linear range specifications on nucleic acid samples commonly used in molecular biology laboratories.
SmartPath™ technology automatically uses multiple pathlengths to enable absorbance measurements across a broad linear range while conserving sample. Each microvolume measurement requires only a 1 μL aliquot of sample.
The DS-11 Series microvolume mode makes it easy to measure samples with concentrations that span 4 orders of magnitude without making dilutions or using special caps or cuvettes.
The DS-11+ model, with its built-in cuvette capability, extends the lower detection range for nucleic samples down to 0.04 ng/μL. The added fluorescence capability of the DS-11 FX models in conjunction with the dsDNA fluorescence assays further extends the sensitivity down to 0.5 pg/μL.
Summary
The ease of use associated with the DeNovix DS-11, coupled with its outstanding precision and linearity over a broad absorbance range, makes this the ideal microvolume spectrophotometer for nucleic acid quantification.
In addition, this versatile stand-alone instrument includes intuitive EasyApps™ software for protein quantification and full spectrum UV-Vis analysis. For measuring up to eight samples at a time, learn more about the DS-8X Eight Channel Spectrophotometer.
Measuring nucleic acid concentrations well below micro-volume absorbance detection limits can also be accomplished. DeNovix fluorometers, including the DS-11 FX, DS-11 FX+, QFX, or add-on FX Module, combined with DeNovix fluorescence quantification assays offer the ability to quantitate down to pg levels with specific dyes for dsDNA or RNA. Learn more:
TN 156 Absorbance and Fluorescence Quantification
TN 162 dsDNA Assay Concentration Limits
TN 200 DeNovix RNA Assay Performance Data
07-APR-2025


