Introduction
The optimal spectrophotometric method for determining the concentration of a protein is dependent upon both the protein and the sample buffers used. Direct measurement of the absorbance at 280 nm is generally applicable when working with purified protein solutions, while colorimetric methods are routinely used for cell lysates and uncharacterized protein solutions.
Colorimetric assays are also used when the protein is suspended in a solution, such as a RIPA buffer, which has a strong absorbance signal in the UV range. Such buffers will interfere with the accuracy of a direct 280 nm measurement.
The DeNovix DS-11 Series EasyApps™ software includes a Colorimetrics app that is optimally configured for the four most common assays. The purpose of this technical note is to present typical DS-11 data for each of the four assays included in the app.
Materials
All assay reagents, including phosphate buffered saline (PBS) (cat #28372) and pre-diluted Bovine Serum Albumin (BSA) Standards (cat #23208), were purchased from Fisher Scientific. The standard set included 0.125, 0.25, 0.50, 0.75, 1.0, 1.50 and 2.0 mg/mL solutions.
The colorimetric assay kits used in the studies were as follows:
Assays
Each assay was performed according to the manufacturer’s directions for the concentration range tested. In brief, tubes of the seven pre-diluted protein standards, along with a PBS buffer only sample, were mixed with the respective assay reagents and incubated as described below.
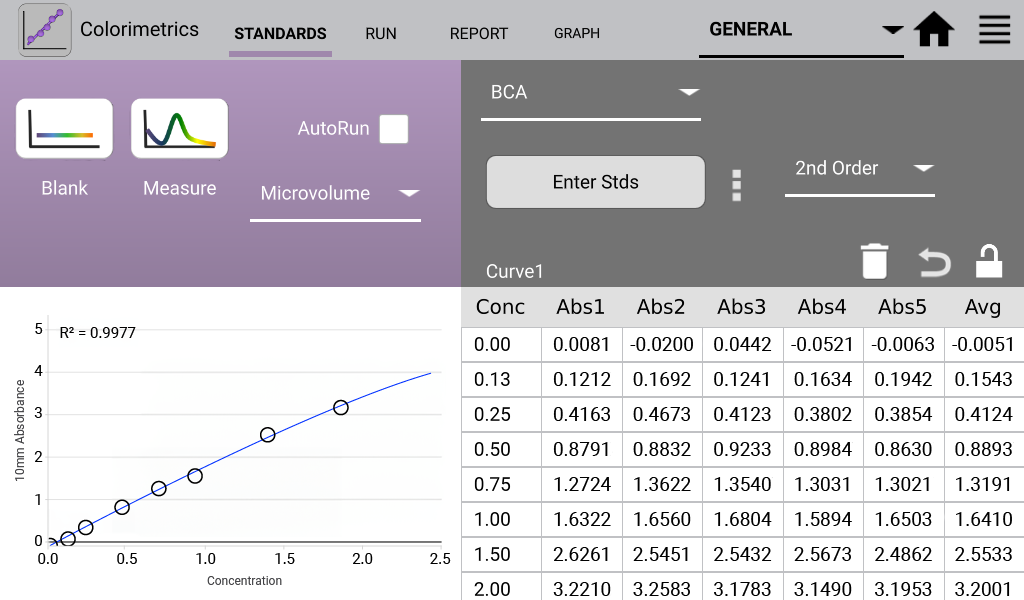
BCA (Analysis at 562 nm)
The detergent compatible bicinchoninic acid assay (BCA assay) is used to quantify proteins by measuring the Cu-BCA chelate formed in the presence of protein.
- Prepared working solution of 50:1 Reagent A:B. Added 1:20 sample volume to working solution. Incubated at 37ºC for 30 minutes.
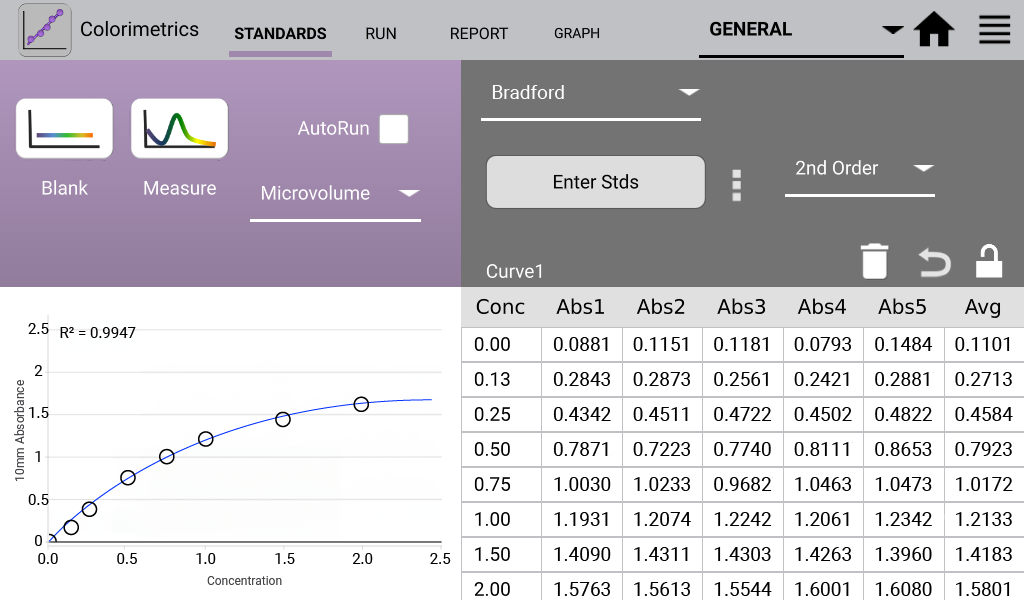
Bradford (Analysis at 595 nm)
The Bradford assay is based upon a protein-induced absorbance shift of a Coomassie Blue dye.
- Added 1:30 sample volume to assay reagent. Incubated solutions at RT for 10 minutes.
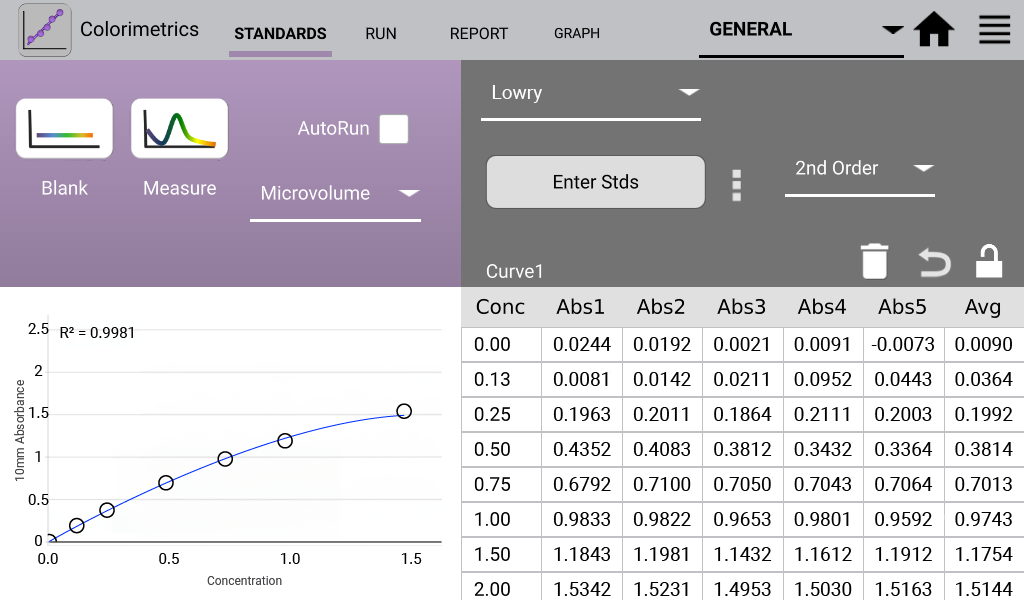
Lowry (Analysis at 650 nm)
The modified Lowry assay is used to quantify proteins based upon the absorbance of tetradentate copper-protein complexes.
- 1x Folin-Ciocalteu reagent was prepared in ultra pure dH2O. One mL of modified Lowry reagent was added to tubes with pre-diluted standards at 15 second intervals. Each tube was mixed well and incubated at room temperature for 10 minutes. 100 µL of 1X Folin-Ciocalteu reagent was added to each tube and immediately vortexed. The tubes were covered and incubated at RT for 30 minutes.
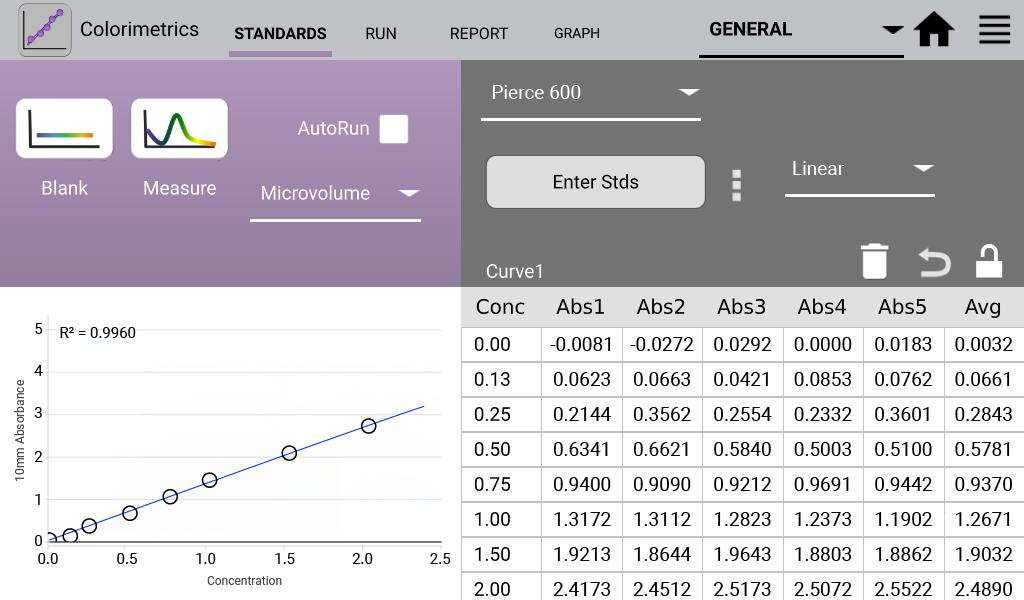
Pierce 660 (Analysis at 660 nm)
The Pierce 660 nm Protein Assay measures a reddish-brown dye-metal complex that changes to green upon protein binding.
- Added 1:15 sample volume to assay reagent, then incubated at RT for 5 minutes.
Microvolume Measurements
Upon launching the Colorimetrics app, the assay type of interest was selected before navigating to the Standard Curve screen. A Blank measurement was established using 1.5 μL of the 0.00 mg/mL solution. A Standard Curve was then generated by measuring five 1.5 μL aliquots of each standard concentration, prepared as previously described.
Each measurement was done using a fresh aliquot of sample. The sample solution was removed between each measurements by wiping the upper and lower sample surfaces with a clean, dry laboratory wipe.
Note: Particulates can form as a function of prolonged color development when using some formulations of the Bradford reagent. These particulates may result in microvolume mode measurement reproducibility issues. Use optimized formulations for best results.
Results
An example curve is shown below for each of the assays included in the Colorimetrics app
(Figures 1 – 4). Data shown are equivalent 10 mm absorbance values.
Summary
The information presented in this document demonstrates that common protein colorimetric assays can easily be performed using DeNovix DS-11 Series instruments. The Standard Curve screen enables the user to measure between two and eight standards and up to five replicates for each concentration. EasyApps software allows the user to save routinely used concentration series or standard curve data sets.
The Run screen (not shown) conveniently includes two graphs types for sample measurements. One type displays the sample absorbance spectrum, while the second displays where the sample falls on the standard curve.
This instrument’s ease of use with the four most commonly used colorimetric assays makes the DS-11 the ideal microvolume spectrophotometer for routine protein quantification.
17-DEC-2024

