Introduction
The turbidity measurement of microbial cultures is a commonly used method to determine the growth phase or cell number in an actively growing culture. Most often, these determinations are done using a spectrophotometer to measure the absorbance at 600 nm. However, the measurements are a measure of light scattering rather than a measurement of absorbed light. OD600 values may differ amongst cell types using one instrument or when measuring the same cell type on different spectrophotometers.
The purpose of this note is to highlight sources of the potential differences observed in OD600 measurements between instruments and present performance data examples from the DeNovix DS-11 Series.
Cell Types
For OD600 measurements, the light passing through the sample is scattered in random directions by cells suspended in the sample. This light scattering is a function of both the specific cell size and shape as well as the density of the cell suspension. Additionally, dead cells and cell debris may contribute to light scattering. Different cell types at the same density (eg. cells per mL) may result in different OD600 values when measured on the same instrument.
Optical Configurations
It is well known that optical configurations of spectrophotometers play a role in the light scatter detected by a specific instrument. Different OD600 values will be reported for the same bacterial culture when measured on spectrophotometers with different optical set-ups. An OD600 of 0.8 using one instrument can be reported as 0.5 on another without being incorrect on either unit.
Conversion Factors
DeNovix DS-11 Series Spectrophotometers / Fluorometers enable the measurement of microbial cultures using either the 1 µL microvolume mode (optimal for higher density cultures) or various path length cuvette modes.
Empirical Target Values
Many investigators rely on target OD600 values obtained from literature sources when harvesting microbial cell cultures or determining the correct density to inoculate a culture for protein expression studies. Unfortunately, these target values may not be appropriate for the combination of the cell type and instrument in use. It is recommended that target OD600 values be empirically determined using growth curves correlating with OD600 values with plate counts for each cell type when using a new spectrophotometer.
The DS-11 Microvolume mode enables much higher OD600 values using its patented automatic path length adjustment. Keeping in mind that the microvolume and cuvette modes use different optical configurations, it may be useful to establish a conversion factor when comparing values measured using the two modes.
It is best to determine the factor using measurements close to the desired target OD600 value. Account for dilutions as appropriate.
An equivalent factor may be determined and then applied to measurements made using different spectrophotometers.

Example Data
The data below is an example of how measuring the same light scattering sample on different spectrophotometers may result in different measured OD600 values (Tables 1 and 2).
A Formazin 4000NTU turbidity standard (Hach cat #246149) was diluted 7.7-fold to produce the initial stock solution. A series of 2-fold serial dilutions in water were then performed. Each solution was measured in triplicate using disposable cuvettes with 2 mL of the respective dilution. No baseline corrections were applied to the 600 nm measurements.
Table 1: Mean OD600 Values; n=3
| Sample | Agilent 8453 | DS-11+ |
|---|---|---|
| Stock | 1.1588 | 0.8376 |
| Stock 1:2 | 0.5696 | 0.4245 |
| Stock 1:4 | 0.2794 | 0.2173 |
| Stock 1:8 | 0.1372 | 0.1125 |
| Stock 1:16 | 0.0684 | 0.0594 |
| Stock 1:32 | 0.0326 | 0.0310 |
| Stock 1:64 | 0.0140 | 0.0158 |
| Sample | Agilent 8453 % CV | DS-11+ % CV |
|---|---|---|
| Stock | 0.61% | 0.24% |
| Stock 1:2 | 0.82% | 1.15% |
| Stock 1:4 | 1.61% | 2.76% |
| Stock 1:8 | 0.63% | 1.92% |
| Stock 1:16 | 0.91% | 3.82% |
| Stock 1:32 | 5.03% | 8.58% |
| Stock 1:64 | 11.17% | 10.82% |
Linear Range
Cuvette based instruments generally have an upper OD limit of around 1.5 for the pathlength measured. OD600 values this high may not be sufficient to cover the entire growth cycle of the culture and may not be linear in regards to growth. Cultures in the death phase may exhibit different light scattering behaviors that may affect the correlation between live cell density and measured OD600 values.
Therefore, careful dilutions of the culture must be made in order to plot the entire growth curve or determine the limit at which measurements no longer linearly correlate with live cell density.
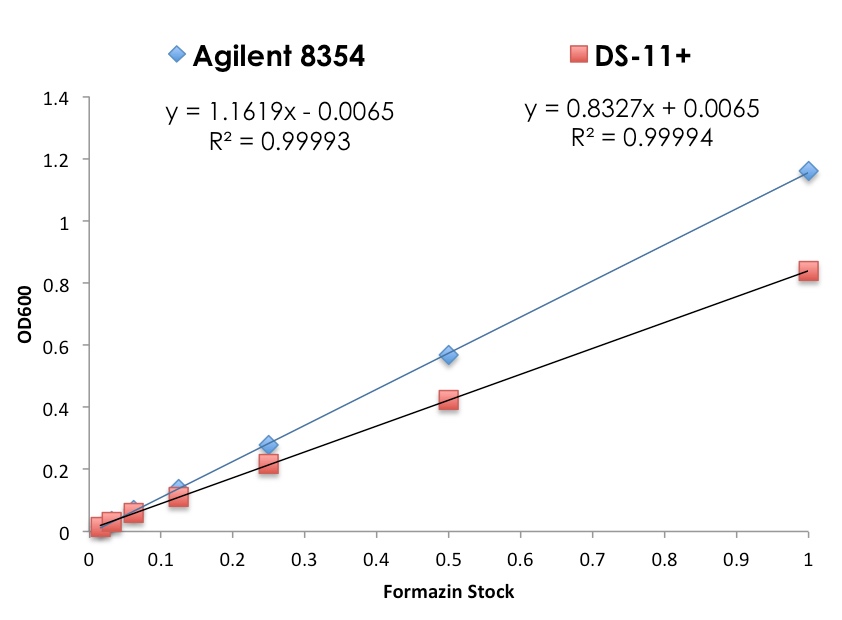
In addition, although a linear relationship between measured OD600 values and specific cell densities may overlap in range on two different instruments, the slope of the linear line may differ. The data from Table 1 is graphed below (Figure 1) as an example of this paradigm.
When using conversion factors to correlate data from one instrument to another, it may be necessary to use different factors for specific OD ranges to compensate for the different slopes.
Note: Although the slopes differ, the R2 values for both instruments are > 0.9999.
OD600 Values and Cell Number
The OD600 app in the DS-11+ software allows the user to enter a cell number factor that will be multiplied by the measured OD600 value to calculate an approximate cells/mL concentration. As previously discussed, OD600 values are dependent on the size and shape of the cells from the solution being sampled as well as the cell density. An OD600 value of 1 might equal approximately 1 x10⁸ cells for one cell type yet equal only 0.5 x10⁸ cells for another.
To use this feature, it is recommended that appropriate cell number conversion factors be initially determined for each cell type. Construct a calibration curve for OD600 values correlated to cell numbers by colony forming units grown on agar plates. Be sure to multiply by dilution factors when appropriate.
Yeast cells are typically larger than bacterial cells. Therefore, an OD600 value of 1 will be generally be equivalent to fewer yeast cells than for bacterial cells.
Best Practices
To ensure the best results, target OD600 values should be empirically determined for each cell type for both the microvolume and cuvette modes.
Cuvette Mode (recommended)
Microvolume Mode
OD at Different Wavelengths
The Formula Methods app enables the creation of customized methods and formulas, including those for measuring OD at wavelengths other than 600 nm. OD at 650 nm, for example can be measured using the following parameters: Analysis nm = 650, Baseline nm = leave blank, Min nm = 550, Max nm = 700.
Summary
DeNovix DS-11 Series instruments enable the measurement of both yeast and microbial cultures using the preconfigured OD600 app.
22-DEC-2025


