Introduction
Green fluorescent protein (GFP) use is ubiquitous in cell and molecular biology as a reporter for gene expression and in many other applications. GFP is an intrinsically fluorescent protein that is easily detected using a fluorometer or fluorescence microscope.
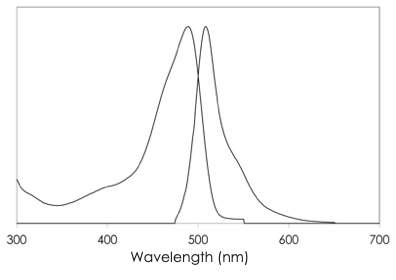
Enhanced GFP (EGFP) is a GFP isoform that is optimized to exhibit improved spectral characteristics for use with mammalian cells. This isoform was used to collect data for this technical note. It has an excitation maximum at 488 nm and an emission maximum at 508 nm, as shown below in Figure 1.

DeNovix QFX Fluorometer and DS-11 Series Spectrophotometer / Fluorometers enable precise GFP quantification using a proprietary optical fluorescence core and four user-selectable LED channels. The data presented in this note was measured using a GFP assay created in the Fluoro Standard Assays app of EasyApps software.
Materials
GFP was fluorescently quantified on a DeNovix QFX Fluorometer using the BioVision GFP Quantitation Kit (cat #K815-100). Sample volumes of 200 µL were measured in 0.5 mL PCR tubes (DeNovix cat #TUBE-PCR-0.5-500).
The provided standard was reconstituted in 100 µL of the provided assay buffer to make 1 µg/µL GFP standard solution. The standard was diluted to 10 ng/µL working solution. This working solution was diluted 10-fold for a high sensitivity standard curve. The actual GFP concentration of the standard was determined via Pierce BCA Protein Colorimetrics Assay (Thermo Fisher Scientific cat #23225).
Methods
Solutions with total GFP concentrations between 0 and 5 ng/µL were prepared gravimetrically by serial dilution from the working solution. The expected concentration of each sample was calculated based on the gravimetric dilutions. Two standard curves were prepared according to the BioVision protocol for accuracy in both a broad sensitivity range and a higher sensitivity range.
The BioVision microplate protocol was adapted for the 200 µL minimum volume required for the QFX fluorometer. Using the Fluoro Standard Assays app on the QFX, a custom method using the blue channel was created to measure GFP. This channel has an excitation wavelength of 470 nm, and the excitation filter includes the GFP excitation maximum of 488 nm. The broad sensitivity standard curve was used to measure concentrations between 0.25 and 5 ng/µL, and the high sensitivity standard curve was used to measure GFP concentrations between 0 and 0.25 ng/µL.
Performance Data
Broad Sensitivity Data
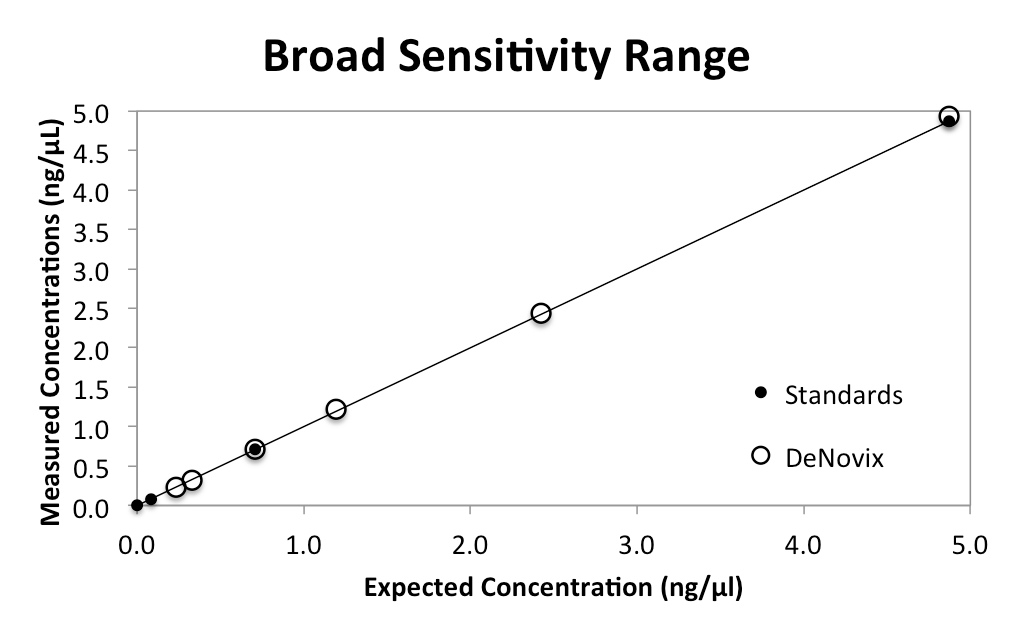
The broad sensitivity standard curve is shown graphically in Figure 2. Table 1 presents the same performance data in tabular form. All data represent the average of three replicate measurements.
The DeNovix QFX enables the creation of a GFP standard curve that accurately quantifies total GFP concentration from 0.232 to 4.87 ng/µL.
Table 1: Broad Sensitivity GFP Performance Data| Expected GFP | Broad Sensitivity Curve | |
|---|---|---|
| ng/µL | ng/µL | StDev |
| 0.232 | 0.231 | 0.005 |
| 0.33 | 0.323 | 0.003 |
| 0.71 | 0.718 | 0.011 |
| 1.19 | 1.214 | 0.030 |
| 2.42 | 2.439 | 0.048 |
| 4.87 | 4.931 | 0.042 |
High Sensitivity Data
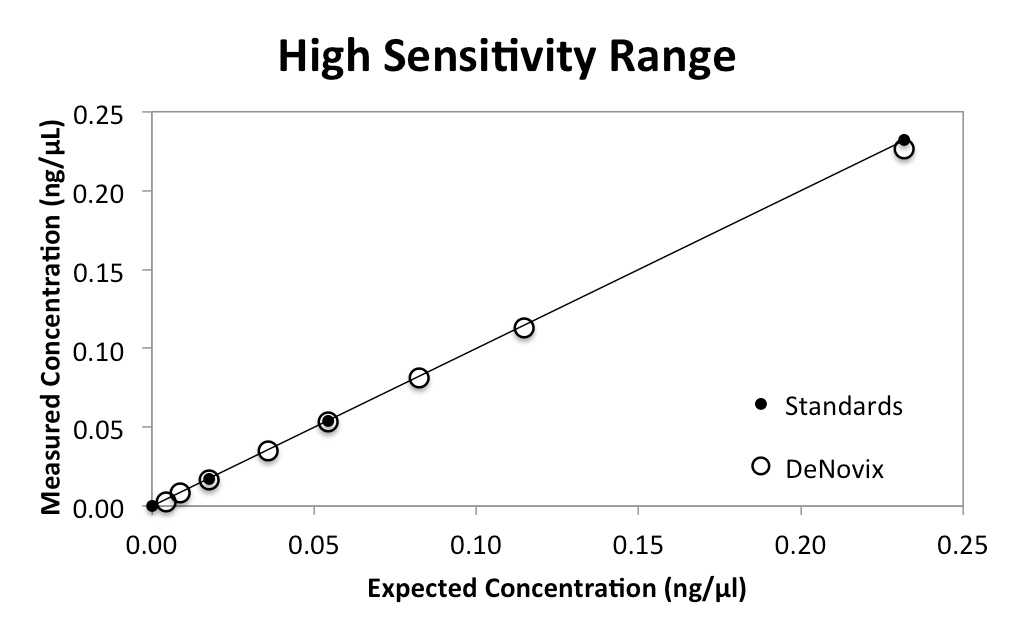
The high sensitivity standard curve and the corresponding data are presented in Figure 3 and Table 2.
Table 2: Broad Sensitivity GFP Performance Data| Expected GFP | High Sensitivity Curve | |
|---|---|---|
| ng/µL | ng/µL | StDev |
| 0.004 | 0.003 | 0.0005 |
| 0.008 | 0.009 | 0.002 |
| 0.018 | 0.016 | 0.004 |
| 0.036 | 0.035 | 0.011 |
| 0.054 | 0.053 | 0.011 |
| 0.082 | 0.081 | 0.016 |
| 0.115 | 0.113 | 0.019 |
| 0.232 | 0.226 | 0.068 |
Summary
The DeNovix Fluorometer enables accurate and precise quantification of GFP through a broad range of concentrations. If in-vivo GFP quantitation is desired, our CellDrop FLi and FLxi Automated Cell Counters allow quantitation of cell transfection. Click here to learn more.
18-JUN-2025


