GFP Protocol Settings
CellDrop EasyApps™ are designed to count a variety of cell lines with minimal customization. If necessary, the user has the ability to optimize count settings after a count has been taken or they can develop a new protocol. Protocols include several powerful settings to enable proper counting of all cell types in a GFP sample while ignoring any debris and dead cells that could compromise the counts.
Developing a Protocol
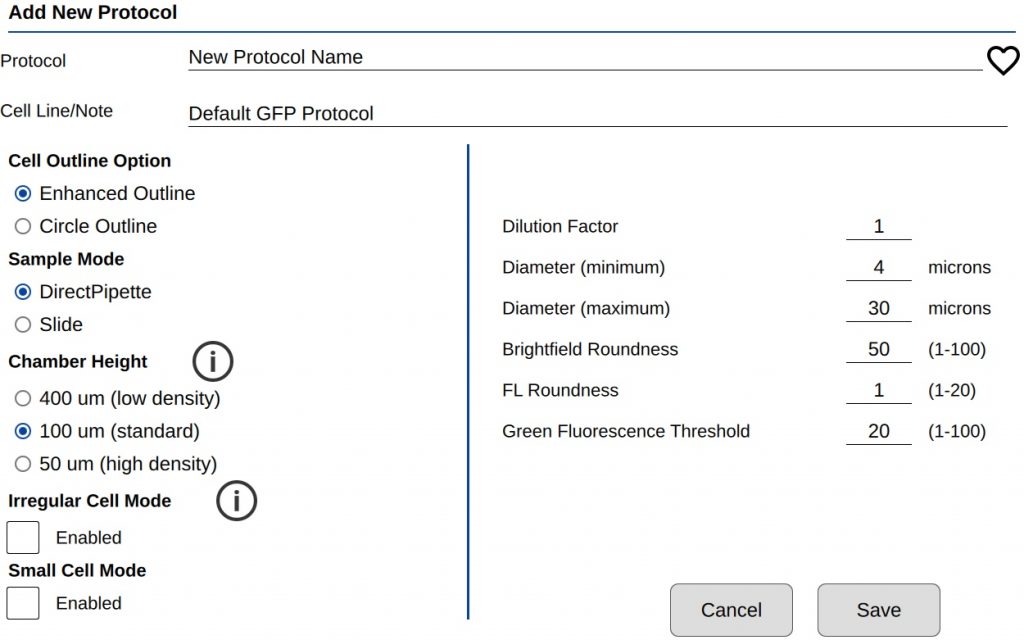
There are two groups of count settings for protocols (Figure 1). On the left side are instrument settings that mainly affect sample loading volume and type. The settings on the right directly affect how a GFP cell is counted. See TechNote 189 Count Settings for additional details.
Optimizing Count Settings
Count settings may be edited after a count is performed by pressing ‘Optimize Settings’ on the results screen. This feature allows a user to properly assess what effect a parameter change has on GFP cell count versus the previous parameter/count.
Counting GFP Cells
When counting a new sample in the GFP app, the best practice is to first load a GFP+ sample and then adjust focus and exposure as necessary. Wipe this sample away, then load a control (GFP-) sample and press count using the Default Protocol. Inspect the resulting image to determine if cells were correctly counted. Use the Optimize Settings feature to adjust count settings until cells are correctly identified.
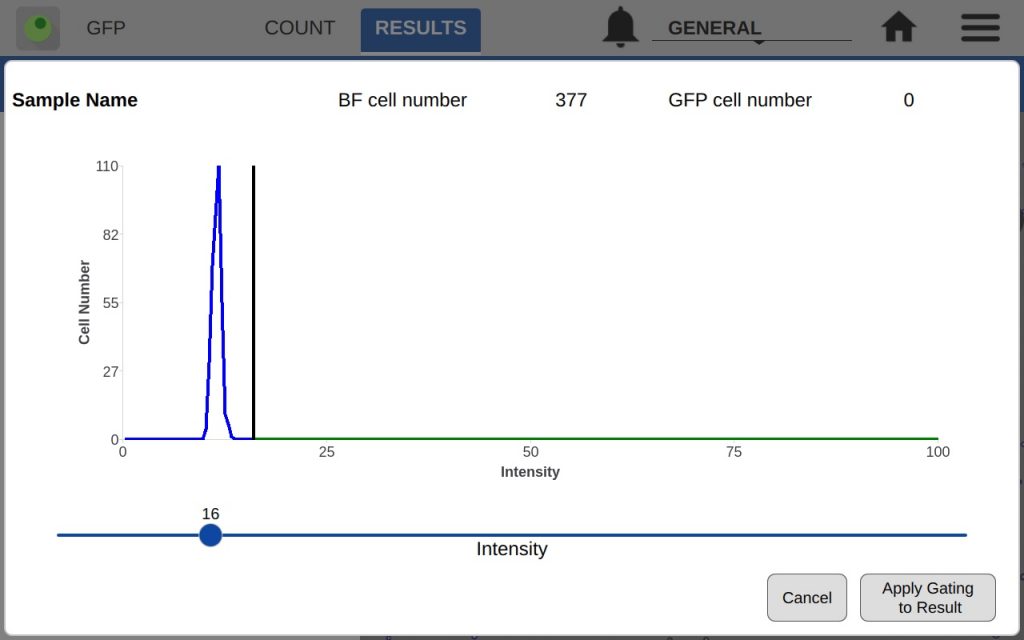
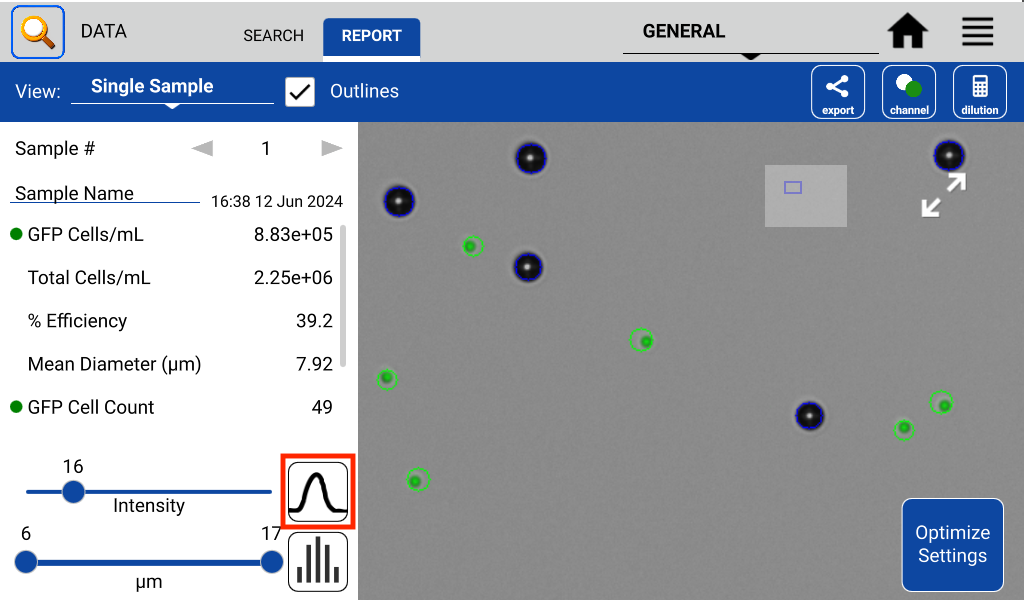
The GFP app also includes an intensity and diameter graph with a slider that is used to increase the accuracy of a GFP count (Figure 2).
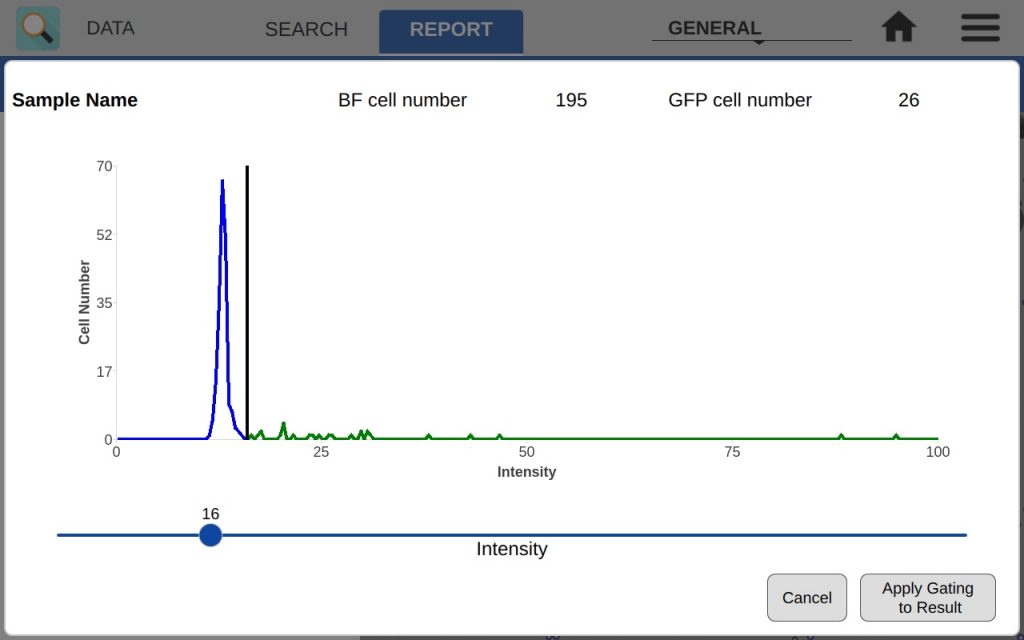
The intensity graph shows the number of cells counted at each GFP intensity level. All non-GFP-expressing cells will have the same intensity – the background intensity. These cells will form a high peak towards the left of the graph. This is an easy indicator of where to place the intensity gate. As shown in Figures 3 and 4, placing the gate slightly to the right of this peak in the control sample will remove any non-GFP cells from the GFP count.
Once the settings and intensity gate have been set, load the GFP+ sample and press count. If only bright GFP cells are to be counted, readjust the intensity slider until the correct cells are counted while excluding cells deemed to be too dim.
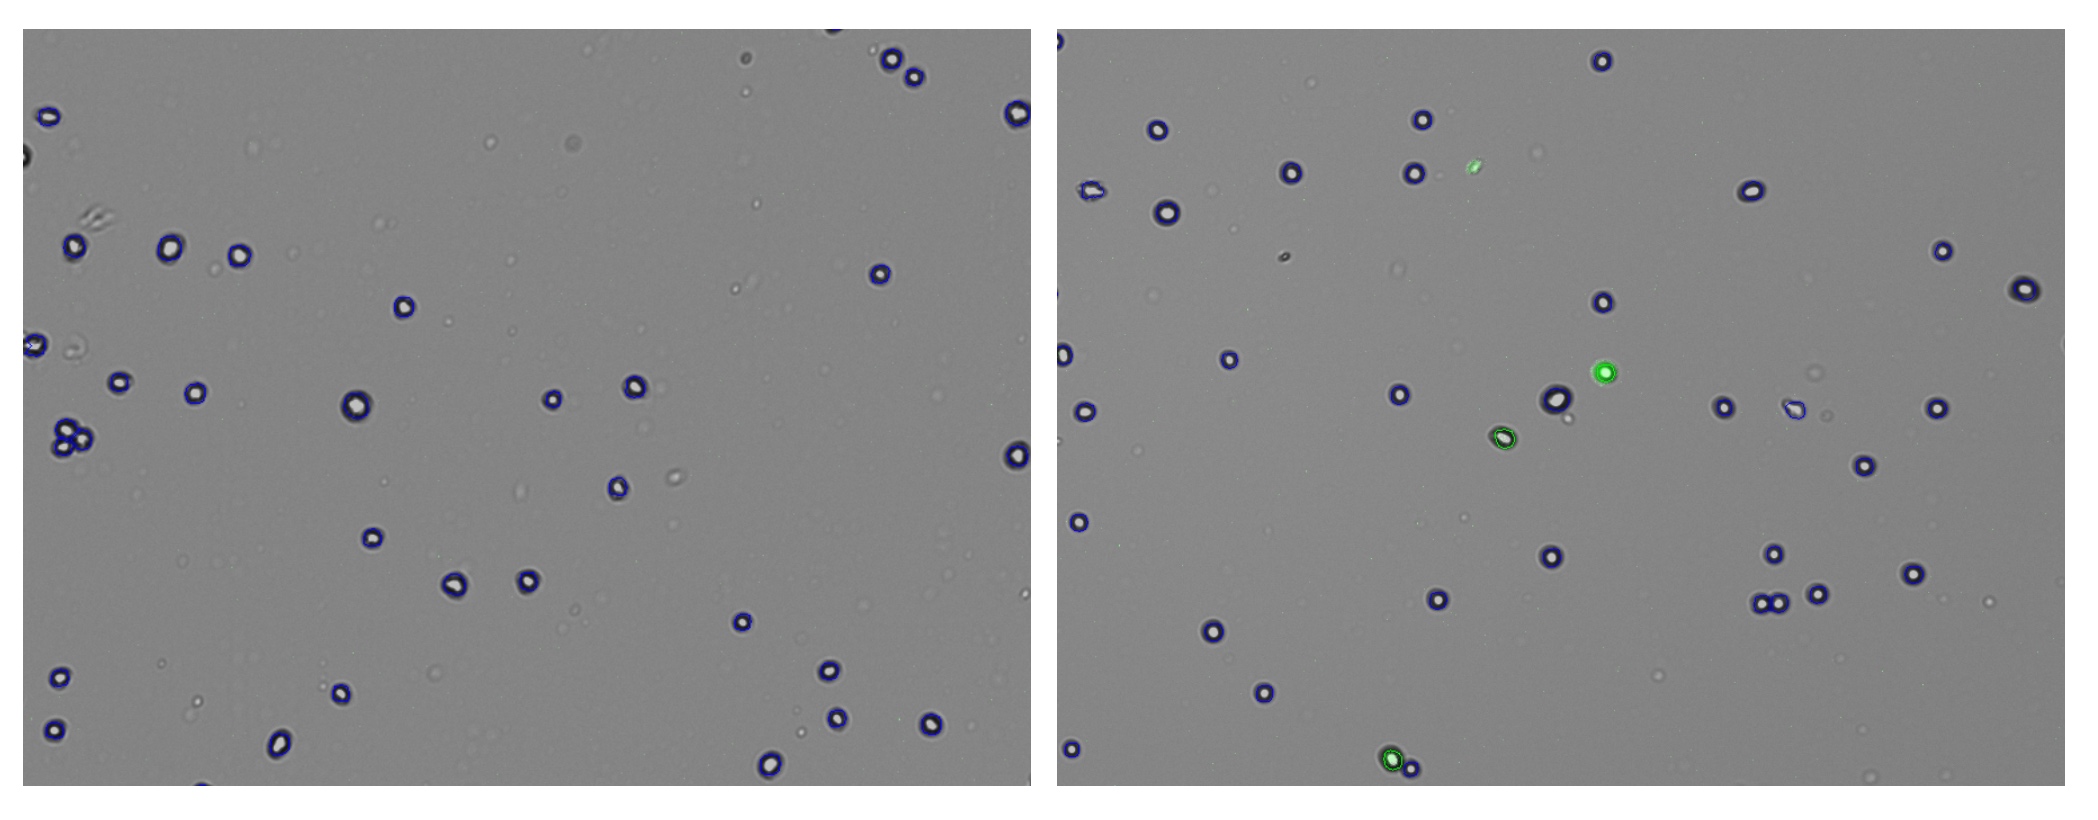
In the example, both the control and GFP-expressing cells have the fluorescent threshold slider set to 16. This prevents bright-field cells from being counted as GFP+ incorrectly. Because transfections can vary greatly in efficiency and fluorescent intensity, this gating procedure should be repeated each time the results of a transfection are measured on CellDrop. Resulting images in Figure 5 show that adjusting the slider has an impact on what cells are counted as GFP+ while the other cells are deemed to be GFP-.
Summary
The CellDrop GFP App functions best when user knowledge and input are used to enhance the results of a count. The CellDrop has powerful counting algorithms and default settings designed to cover a broad number of cell lines. The CellDrop is designed to provide rapid results with settings that can be easily adjusted to enhance the accuracy of a count. The software includes intensity and diameter graphs as well as counted result images to help researchers correctly count the GFP cells. The app ensures that the count is accurate and acceptable to each researcher.
If desired, DeNovix also offers DS-11 Series Spectrophotometers / Fluorometers to easily quantitate GFP proteins by either absorbance or fluorescence based methods. Click here to learn more.
18-JUN-2025


